My all boys' class has been reading Mark Haddon's
Curious Incident of the Dog in the Nighttime. We also started our essential questions for our following units:
Why are relationships so difficult? What do relationships reveal about who we are and who we want to be?
Throughout our study of Curious Incident, I asked the kids to keep
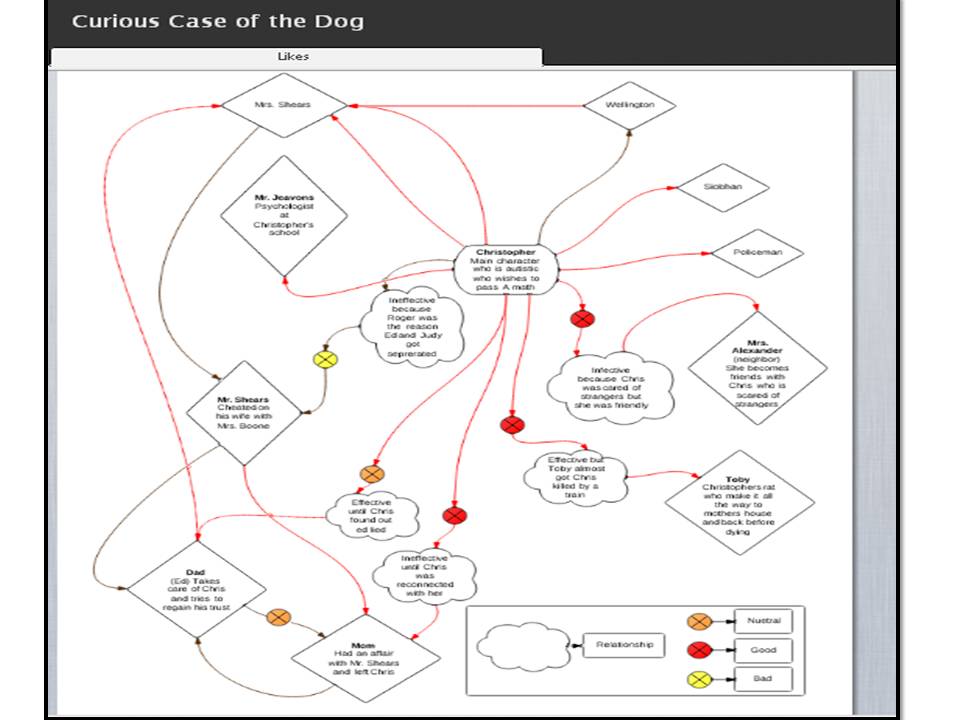
a relationship chart of all the characters. They needed to identify who the main characters were, give a description about the characters, how do the characters relate to one another, explain whether or not the relationship is an effective one or not, and why. Instead of writing this all out, I asked the kids to graphically show their understanding of these relationships. Previously, I have used
Webspiration for this project. However, this year I discovered Webspiration was no longer free. So, after speaking with Dana Levesque at our district office, she pointed me in the direction of
LucidChart. She hadn't used LucidChart, but wanted to see what we could do with it.
It was fantastic! It did exactly what the kids wanted it to do. They could assign shapes to characters (there is a plethora of shapes to choose from on the side bar), assign colors to relationships (Christopher, the main character in the book, assigns colors to good things and bad things so the kids wanted to mimic his likes and dislikes), create lines connecting the characters (they could use colored lines, dotted lines, arrows, etc...), add legends and keys to explain their thinking, etc... The kids could take the program exactly where how they wanted to showcase their learning and understanding about relationships from the novel. Additionally, since we are a
Google Apps for Education school, the kids could automatically sign in with their Google Account- no need to create a separate log-in! Finally, the kids can share their projects with one another. They can invite others to graph their charts collaboratively.
A couple of things that I would like to see different- it is hard to see all of your connections on one screen. We are presenting 5 of the relationship connections in class right now, and we are having to move the mouse around to get to all the relationships they want to talk about. Secondly, LucidChart limits the number of connections a student can make on each chart. 60 pieces is all they are able to display. Finally, under the free account, they are only able to create 3 charts and only share with three people. However, it is a free program!
Here are screen shots of some sample kid projects:


No comments:
Post a Comment